Tools Of The Trade
The operating model itself doesn't need any of these tools to exist — it needs the thinking in the six domains. But real design work goes faster and stays honest with the right technique in hand: a canvas to get a business model onto one page, a matrix to make a decision right explicit, a map to see which way a capability is evolving. This page is a practical reference to the tools most useful at each stage of operating model work, cross-linked to the domain they support.
Strategy & Direction Tools
Supports the Strategy & Direction domain — vision, strategy, business model, value proposition, and design principles.
Business Model Canvas
What it is: a one-page canvas (Osterwalder & Pigneur) with nine building blocks — customer segments, value propositions, channels, customer relationships, revenue streams, key resources, key activities, key partnerships, and cost structure — used to describe a business model on a single sheet.
Value in operating model work: it forces the Business Model and Value Proposition concepts to be written down explicitly and validated together, rather than assumed. It is the fastest way to get a business model out of people's heads and onto one page leadership can actually argue about.
When to use it: early, before operating model design starts — when the business model itself is unclear, contested, or has never been written down, or when testing a new venture or business unit's value logic.
Constraints: it describes the what, not the how — it has no concept of process, organisation, or capability, so it stops exactly where operating model design needs to begin. It is also easy to fill in superficially without real customer evidence.
Opportunities: pairs directly with the Value Proposition Canvas for a deeper customer-fit check, and gives design principles something concrete to trace back to.
Alternatives: a Lean Canvas — more start-up and risk-focused, swapping some blocks for problem/solution and key metrics — where the venture is earlier-stage and riskier than an established business model.
Authoritative source: Strategyzer — Business Model Canvas, the official source from creators Alexander Osterwalder and Yves Pigneur.
Download template: Business & Value Proposition Canvases (PPTX, 2 slides — includes the Value Proposition Canvas below).
Value Proposition Canvas
What it is: a companion to the Business Model Canvas that zooms into one block — mapping customer jobs, pains, and gains against the products, pain relievers, and gain creators the value proposition offers.
Value in operating model work: it tests the Value Proposition concept directly against real customer evidence, which is exactly the discipline that domain calls for — a value proposition specific enough to test a design decision against.
When to use it: when the value proposition is vague, aspirational, or has never been checked against what customers actually experience — commonly alongside customer research or journey mapping.
Constraints: it is only as good as the customer evidence behind it. Run without real customer input, it just formalises internal assumptions with more structure.
Opportunities: a strong input to value stream design in Operating Model Core — the "gain creators" and "pain relievers" often point directly at the stages a value stream needs to get right.
Alternatives: direct customer journey mapping, where the concern is the end-to-end experience over time rather than the fit between a specific pain and a specific offer.
Authoritative source: Strategyzer — Value Proposition Canvas, the official companion canvas from the same creators as the Business Model Canvas.
Download template: Business & Value Proposition Canvases (PPTX, 2 slides — same file as the Business Model Canvas above).
What it is: a structured format for writing a design principle — typically name, statement, rationale, and implications, the format used in TOGAF's architecture principles practice — rather than a free-text list of good intentions.
Value in operating model work: Design Principles are only useful if they are decisive and testable. A consistent format forces every principle to state its rationale, traceable to strategy, and its implications, what it actually changes — exactly what stops a principle set collapsing into a list of platitudes.
When to use it: whenever design principles are being drafted or ratified — particularly useful for forcing out the "implications" that reveal whether a principle actually does any work.
Constraints: the format disciplines how a principle is written, not whether it is any good — a well-formatted platitude is still a platitude. It also does nothing to rank principles against each other.
Opportunities: combine with a simple forced-ranking exercise, such as pairwise comparison, to solve the ranking problem the format alone doesn't address.
Alternatives: a lighter "principle one-liner plus example" format where speed matters more than rigour, accepting some loss of traceability.
Authoritative source: The Open Group — TOGAF, whose architecture principles practice this format is drawn from.
Download template: Design Principles Register (XLSX, with worked examples and a "How To Use" sheet).
Operating Model Core Tools
Supports the Operating Model Core domain — the operating model itself, its capabilities, and its value streams.
Operating Model Canvas
What it is: a one-page canvas built around POLISM: Processes, Organisation, Locations, Information, Suppliers, and Management Systems. Together these describe the work that delivers the value proposition, who performs it and how they are organised, where it happens and which assets it needs, the supporting information systems, supplier relationships, and the systems used to plan, budget, manage performance and risk, improve, and manage people.
Value in operating model work: it is the direct working tool for the Operating Model concept itself — a consistent template to describe current and target states so they can genuinely be compared, which the domain names as one of the core things an architect needs to do.
When to use it: any time the operating model needs to be described as a whole — baselining the current state, drafting the target state, or communicating either to leadership in a single artefact.
Constraints: a one-page canvas necessarily compresses detail. It is a communication and alignment tool, not a substitute for detailed design. POLISM is the structure of this canvas; it should not be replaced by the site's separate six design dimensions.
Opportunities: use the same canvas format for both current and target state so gap analysis becomes a direct block-by-block comparison rather than two differently-shaped documents.
Alternatives: a full operating model blueprint or detailed design pack, where the audience needs implementation-level detail rather than a one-page summary.
Authoritative source: Operating Model Canvas by Andrew Campbell, Mikel Gutierrez, and Mark Lancelott.
Download template: Operating Model Canvas & Value Stream Map (PPTX, 2 slides — includes the Value Stream Map below).
Business Capability Model (Heat Map)
What it is: a hierarchical map of what the organisation must be able to do, typically two or three levels deep, often colour heat-mapped by maturity, importance, cost, or risk.
Value in operating model work: it is the direct working tool for the Capabilities concept — the stable, structure-independent map that capability assessment scores, that the current and target operating models are anchored to, and that gap analysis is organised against.
When to use it: at the very start of operating model work, before capability assessment can happen, and kept alive as a living reference throughout, not just built once.
Constraints: building a good one is genuinely hard the first time. It is easy to accidentally reproduce the org chart with different labels, and easy to over- or under-decompose the levels.
Opportunities: heat-map it against more than one dimension at once — maturity and importance together, as in the capability assessment quadrant — so investment priorities are visually obvious rather than buried in a spreadsheet.
Alternatives: a value chain model in the Porter tradition, where the organisation wants to emphasise the sequential flow of primary and support activities rather than an abstracted list of abilities.
Authoritative source: Business Architecture Guild, publisher of the BIZBOK reference model for business capabilities.
Download template: Capability Heat Map (XLSX, with conditional-formatting heat map and a live quadrant chart).
Value Stream Mapping
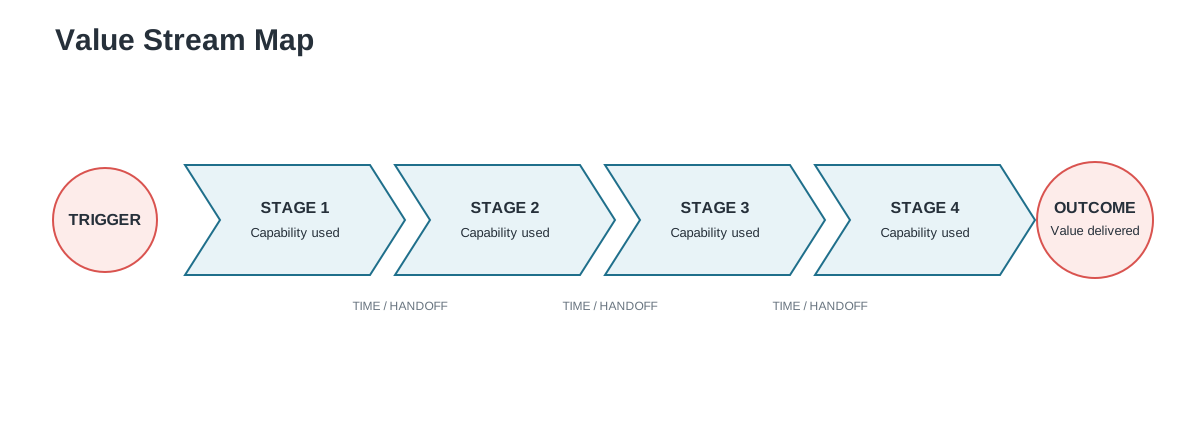
What it is: a technique for mapping an end-to-end flow of value from trigger to outcome, stage by stage, typically recording the time, handoffs, and delay at each step.
Value in operating model work: it is the direct working tool for the Value Streams concept — the outside-in, cross-cutting view that a capability map alone cannot provide, and the way real handoff delay and risk actually get exposed.
When to use it: whenever a specific customer or business outcome is slow, inconsistent, or clearly crossing more organisational boundaries than the org chart would suggest.
Constraints: classic value stream mapping comes from manufacturing and can carry assumptions — highly linear, single-piece flow — that do not transfer cleanly to knowledge work or highly branching digital journeys without adaptation.
Opportunities: overlay it directly onto the capability heat map, exactly as shown on the Operating Model Core page, to see at a glance which capabilities a given value stream actually depends on.
Alternatives: customer journey mapping, where the emphasis is the customer's subjective experience and emotion at each touchpoint rather than the internal flow, time, and handoffs.
Authoritative source: Lean Enterprise Institute, the standard reference for value stream mapping technique.
Download template: Operating Model Canvas & Value Stream Map (PPTX, 2 slides — same file as the Operating Model Canvas above).
Design Dimensions Tools
Supports the Design Dimensions domain — the six levers an operating model is designed across.
Process Lifecycle Completeness
What it is: a ten-phase by three-layer assessment that tests whether the processes governing a service, capability, product or other thing cover its complete life. Each intersection is assessed across Business, Information Systems and Technology; a justified N/A is permitted, but silence is treated as a gap.
Value in operating model work: it exposes missing ownership, controls and hand-offs that a conventional end-to-end process map can hide, especially after deployment and before retirement.
When to use it: when defining, reviewing or assuring any operating-model process set, and whenever a material change alters the lifecycle, layer boundaries or accountabilities.
Completion rule: an applicable process needs an accountable owner, intended outcome, inputs, outputs, controls and evidence, and predecessor/successor hand-offs. An N/A needs a recorded rationale.
Download template: Process Lifecycle Completeness Toolkit (XLSX, pre-populated with the 113 defined Architecture and Security Architecture services as processes, plus lifecycle reference, coverage formulas, controlled statuses and gaps tracker).
Wardley Mapping
What it is: a mapping technique that plots the components a value chain depends on against two axes — visibility to the user, and evolution from genesis through custom-built and product to commodity/utility.
Value in operating model work: it adds the one thing a static capability or maturity assessment cannot show — which way a capability is moving — and is the natural technique behind the sourcing decisions in Locations & Sourcing.
When to use it: when a build-versus-buy or sourcing decision is genuinely contested, or when a capability's maturity looks fine today but its market position needs checking.
Constraints: positions on the map are judgement calls, not hard data. It is easy to do badly, and it has its own notation and learning curve that takes time to use well in a group setting.
Opportunities: run it alongside the capability assessment quadrant already used in Building The Model, rather than instead of it — maturity tells you how well you do it today, evolution tells you where the market is heading regardless.
Alternatives: a straightforward build-vs-buy decision matrix, where the group needs a faster, less nuanced answer and doesn't need the full evolutionary reasoning.
Authoritative source: Learn Wardley Mapping, Simon Wardley's free book, and Online Wardley Maps, the free mapping tool.
Download template: Wardley Map & McKinsey 7S Templates (PPTX, 2 slides — includes the 7S template below). For real mapping work, prefer the dedicated tools above.
McKinsey 7S Framework
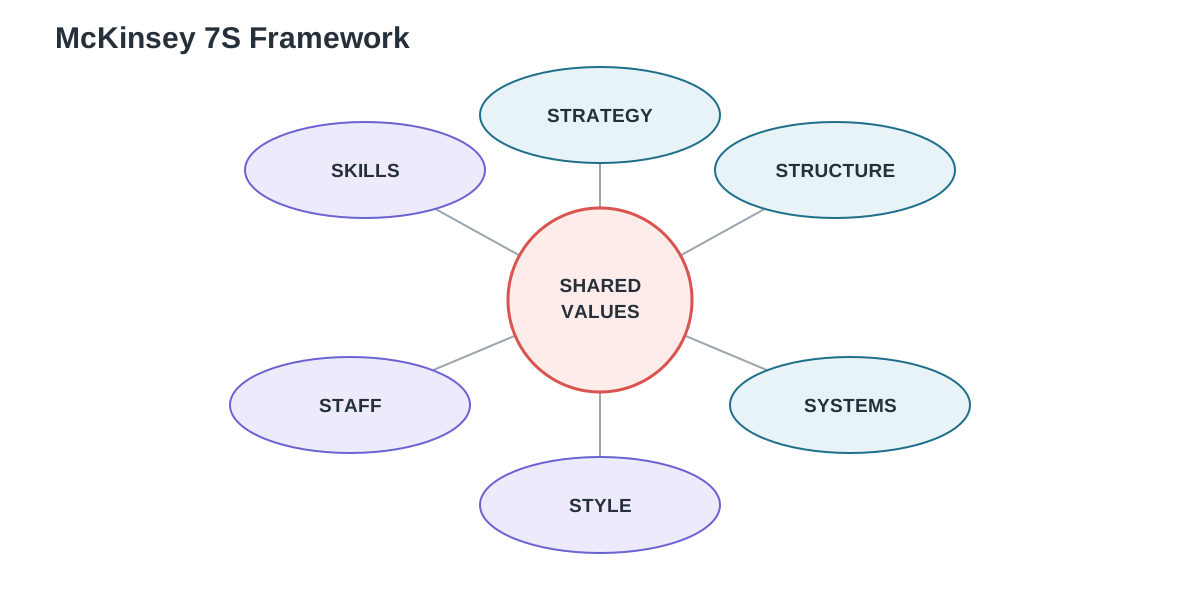
What it is: a classic organisational alignment model with seven interdependent elements — strategy, structure, systems, shared values, style, staff, and skills — used to check that they all pull in the same direction.
Value in operating model work: it overlaps significantly with the Design Dimensions and Context & People domains, and running it alongside a six-dimension design can surface soft factors — style, shared values — that the six dimensions don't name explicitly.
When to use it: as a lighter-weight cross-check when a full six-dimension redesign feels like overkill, or specifically to surface culture and leadership style questions the design dimensions don't cover on their own.
Constraints: its categories overlap awkwardly with the six design dimensions used throughout this model. Running both in full is duplicative, and 7S has less to say about information, data, technology, or sourcing specifically.
Opportunities: use it as a translation aid when working with stakeholders who already know 7S, mapping its language onto the six design dimensions rather than replacing them.
Alternatives: the six design dimensions themselves, where the audience doesn't already have a 7S habit and a more technology- and data-aware model is needed.
Authoritative source: McKinsey & Company, originators of the 7S framework in the late 1970s.
Download template: Wardley Map & McKinsey 7S Templates (PPTX, 2 slides — same file as Wardley Mapping above).
Governance & Performance Tools
Supports the Governance & Performance domain — decision rights, policies, and measurement.
RACI / RASCI Matrix
What it is: a matrix naming, for each decision or activity, who is Responsible, Accountable, Consulted, and Informed — RASCI adds Supportive.
Value in operating model work: it is the direct working tool for Decision Rights — the concept the model names as the commonest cause of operating model failure when left ambiguous. A RACI forces every decision onto the matrix by name, not by topic area.
When to use it: whenever a decision or accountability is disputed, duplicated, or nobody can actually say who owns it — and always before finalising governance forums, so the forums have real decisions to make.
Constraints: a RACI is only as good as the granularity of the decisions listed. "Who owns data" is too vague to put on a matrix usefully; it needs to be broken down to specific, named decisions first.
Opportunities: run it specifically for security risk acceptance and control exception decisions — one of the most commonly left-ambiguous rights, per the Governance & Performance domain.
Alternatives: a simpler decision log, or a RAPID-style framework (Recommend, Agree, Perform, Input, Decide), where the organisation finds RACI's categories don't map cleanly onto how it actually makes decisions.
Authoritative source: Project Management Institute, whose bodies of knowledge reference RACI as a standard responsibility-assignment technique.
Download template: Governance Toolkit — RACI, Scorecard & OKRs (XLSX, with dropdown validation and 3 sheets — includes the Balanced Scorecard/OKR tracker below).
Balanced Scorecard / OKRs
What it is: two related techniques for setting and cascading performance measures — the Balanced Scorecard groups measures across financial, customer, process, and learning perspectives; OKRs (Objectives and Key Results) set a qualitative objective with measurable key results underneath it.
Value in operating model work: both give Performance Measures a structure that resists the drift toward measuring whatever is easy to extract — the Balanced Scorecard by forcing multiple perspectives, OKRs by forcing every measure to trace to a stated objective.
When to use it: when performance measures have multiplied into a long, unfocused dashboard, or when a new target operating model needs its success criteria set from scratch.
Constraints: both can degrade into box-ticking if the objectives or perspectives are set once and never revisited. A scorecard or OKR set is only as good as the review discipline behind it.
Opportunities: use OKRs specifically to connect Continuous Improvement initiatives back to a stated objective, so improvement work stays traceable rather than becoming a backlog of disconnected fixes.
Alternatives: a simple, small set of named outcome KPIs with no additional framework, where the organisation is small enough that a formal scorecard or OKR cadence would be overhead rather than help.
Authoritative source: Balanced Scorecard Institute (Kaplan & Norton's framework), and What Matters for OKRs.
Download template: Governance Toolkit — RACI, Scorecard & OKRs (XLSX, 3 sheets — same file as the RACI matrix above).
Building The Model Tools
Supports the Building The Model domain — capability assessment, gap analysis, and the transition roadmap.
Maturity Models
What it is: a graded scale, commonly five levels from ad hoc or initial through to optimised, used to describe how capable an organisation is at performing a specific capability. CMMI is the best-known example.
Value in operating model work: it is the direct working tool behind the maturity axis in Capability Assessment, giving every capability owner a common yardstick instead of a subjective "how are we doing" conversation.
When to use it: at the start of capability assessment, and consistently reapplied at each assessment cycle so maturity scores are comparable over time.
Constraints: an off-the-shelf maturity model may not match your specific capabilities well out of the box — it usually needs adapting, and a badly adapted scale produces scores nobody trusts.
Opportunities: pair the maturity axis directly with the importance axis, as shown in the Building The Model quadrant, so maturity never gets read in isolation from how much a capability actually matters.
Alternatives: a simpler traffic-light rating — red, amber, green — where speed and simplicity matter more than the ability to track fine-grained progress between levels.
Authoritative source: CMMI Institute (part of ISACA), publisher of the best-known maturity model of this kind.
Download template: Building The Model Toolkit — Maturity, MoSCoW & Impact/Effort (XLSX, 3 sheets — includes the prioritisation templates below).
Prioritisation Techniques (MoSCoW, Impact/Effort Matrix)
What it is: two lightweight techniques for turning a long list into an ordered one — MoSCoW sorts items into Must/Should/Could/Won't have; an Impact/Effort matrix plots items on axes of expected impact and delivery effort.
Value in operating model work: both give Gap Analysis and the Transition Roadmap a repeatable way to argue about sequencing — which gaps close first — rather than defaulting to whichever gap was raised most recently or loudest.
When to use it: once gaps have been sized and characterised, and the roadmap needs to decide what goes into the first transition state versus a later one.
Constraints: both are only as good as the honesty of the inputs. Impact and effort estimates done quickly in a workshop can be as much guesswork as they are analysis, and MoSCoW categories can be gamed by calling everything "must have."
Opportunities: combine with the dependency mapping already required in Gap Analysis — impact and effort alone can still recommend a sequence that ignores a blocking dependency.
Alternatives: pure dependency-first sequencing with no impact/effort scoring at all, where the technical dependencies are so constraining that prioritisation barely matters — do the foundational work first regardless of impact.
Authoritative source: Agile Business Consortium, publisher of DSDM and the origin of MoSCoW. The impact/effort matrix has no single authoritative body — it is a widely used lean and agile convention.
Download template: Building The Model Toolkit — Maturity, MoSCoW & Impact/Effort (XLSX, 3 sheets, with a live quadrant chart — same file as Maturity Models above).